


Week of March 25, 2024 in Review
Progress on the Fed’s preferred inflation measure has stalled, while the latest data on appreciation and signed contracts show strength in the housing sector.
Progress Stalls on Inflation
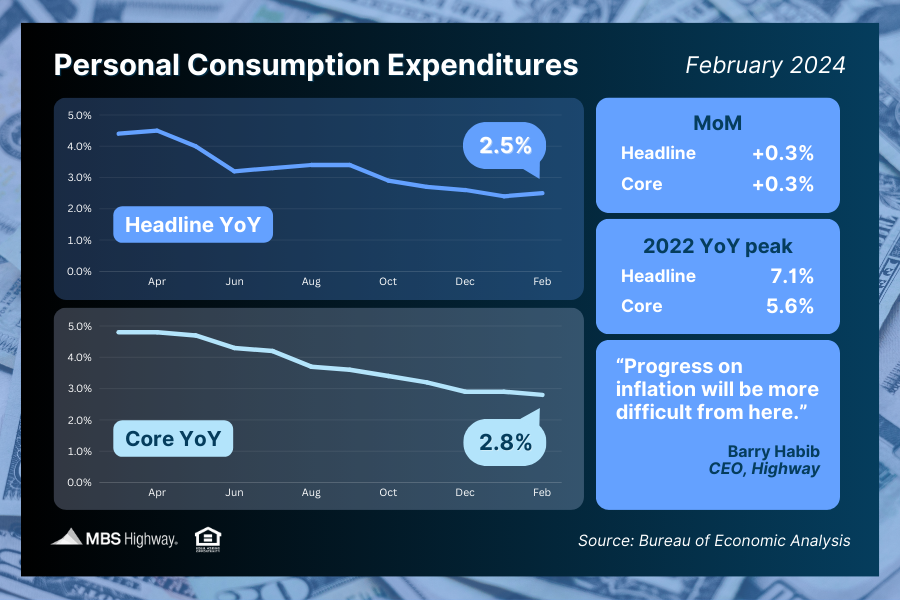
February’s Personal Consumption Expenditures (PCE) showed that headline inflation rose 0.3% from January, with the year-over-year reading up from 2.4% to 2.5%. Core PCE, the Fed’s preferred method which strips out volatile food and energy prices, rose by 0.3% monthly. The year-over-year reading fell from 2.9% to 2.8%, pushing this important metric one step closer to the Fed’s 2% target and its lowest level in almost three years!
What’s the bottom line?The Fed has been working hard to tame inflation, hiking its benchmark Fed Funds Rate (which is the overnight borrowing rate for banks) eleven times between March 2022 and July 2023. These hikes were designed to slow the economy by making borrowing more expensive, lowering the demand for goods, and thereby reducing pricing pressure and inflation.
The Fed wants to see annual inflation as measured by Core PCE return to its 2% target, though they’ve indicated they won’t “wait to get to 2% to cut rates.” While the latest 2.8% Core PCE reading is much lower than the 2022 peak of 5.6%, progress has been slowing. So, the question remains: When will the Fed think inflation has progressed low enough for them to start cutting the Fed Funds Rate later this year?
Media Mixed Up About Mix of New Home Sales
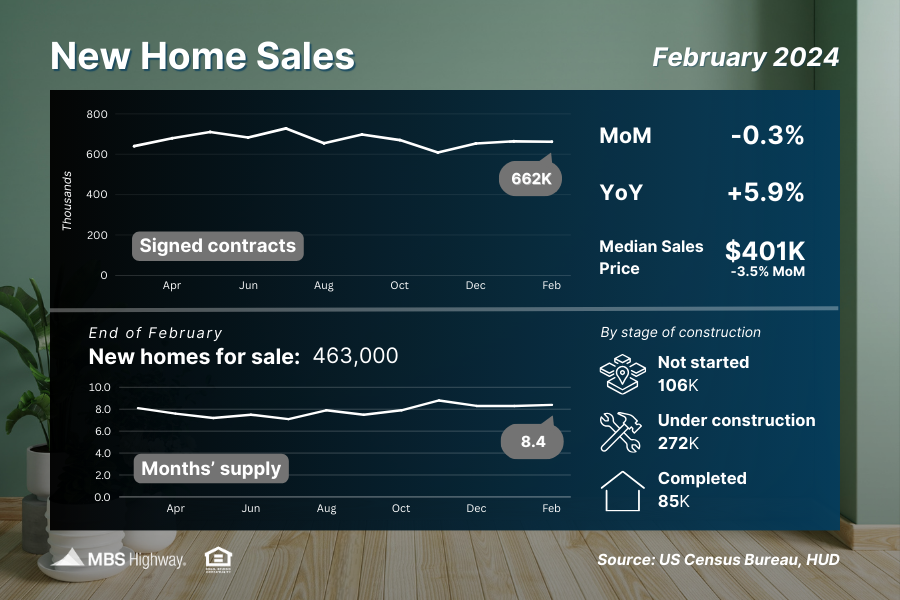
After two consecutive months of gains, New Home Sales (which measure signed contracts on new homes) inched down 0.3% from January to February. While the media tried to put a negative spin on the report, home sales remaining stable in February shows some strength given that rates moved higher when compared to January. Plus, sales were also 5.9% higher than a year earlier, as the persistent shortage of previously owned homes for sale continued to fuel demand for new construction.
What’s the bottom line? The media also pointed to the decline in the median home price, which was down 3.5% from January and 7.6% from a year ago, to say the report was a miss. But the median home price did not decline because of falling home prices (which continue to hit new highs per Case-Shiller and other indexes), or a growing number of price cuts from builders. In fact, just 24% of builders reported slicing prices in March, down from 36% in December and the lowest share since last July per the National Association of Home Builders.
The median home price represents the mid-price of sales, meaning it’s influenced by the mix of sales in any given month. February’s decline in the median home price stems from the sale of more homes at lower price points. Builders are constructing smaller, more affordable homes to meet buyer demand, and that pushed the median home price lower comparatively.
More Signed Contracts Despite Higher Rates
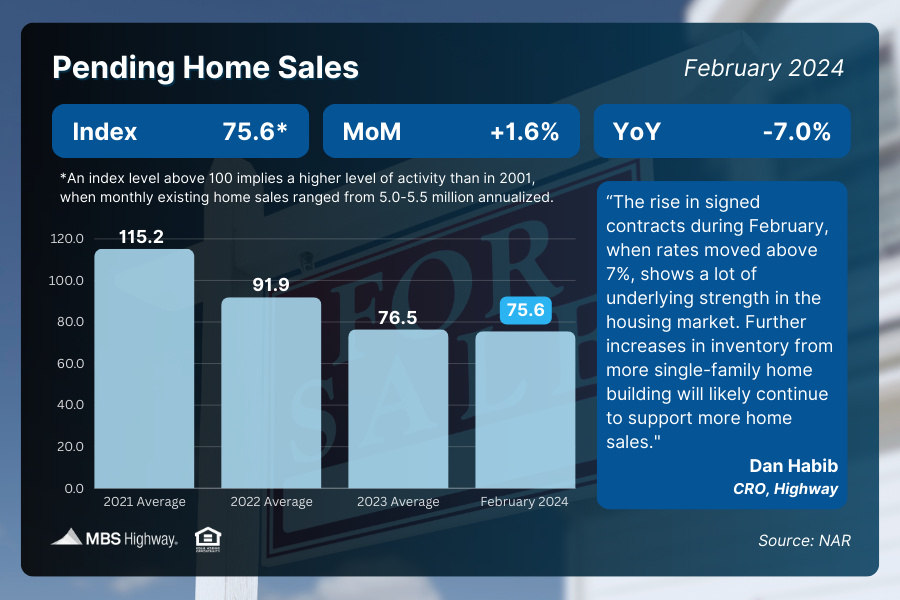
Pending Home Sales rose 1.6% from January to February per the National Association of REALTORS (NAR), which is another sign of underlying strength in the housing market given February’s uptick in rates. This report measures signed contracts on existing homes, making it an important forward-looking indicator for closings on these homes, which are measured in the Existing Home Sales report.
What’s the bottom line? NAR’s Chief Economist, Lawrence Yun, noted that the modest sales growth “shows slow and steady progress from the lows of late last year.” He added that a “steady rise in inventory” is also expected this year, which is good news for buyers as we approach the busy spring season.
Higher Trend in Home Prices Continues
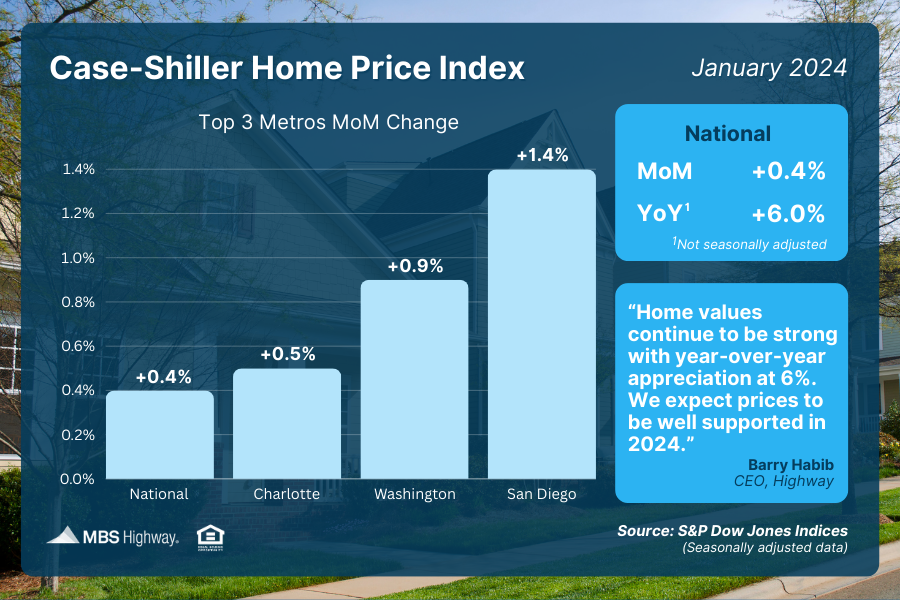
The Case-Shiller Home Price Index, which is considered the “gold standard” for appreciation, showed home prices nationwide rose 0.4% from December to January after seasonal adjustment. Home values in January were also 6% higher than a year earlier, with S&P DJI’s Head of Commodities, Brian D. Luke, explaining that this was the “fastest annual rate since 2022.” He added that all 20 cities in their composite index saw annual price increases for the second straight month.
The Federal Housing Finance Agency’s (FHFA) House Price Index did report a slight 0.1% decline in home values from December to January, but on an annual basis prices were 6.3% higher than the previous year. Note that FHFA does not include cash buyers or jumbo loans, and these factors account for some of the differences in the two reports.
What’s the bottom line? Last year was a strong one for appreciation, and the first reports for 2024 show that this trend continues. Home values are expected to remain supported this year, as buyer demand still outpaces tight supply. These indexes show that homeownership continues to provide opportunities for building wealth through real estate.
What to Look for This Week
The labor sector will be in focus, with updates on job openings (Tuesday), private payrolls (Wednesday), unemployment claims (Thursday), and nonfarm payrolls and the unemployment rate (Friday).
Technical Picture
Mortgage Bonds ended last week trading in a wide range between support at their 50- day Moving Average and overhead resistance at 101.273. Wide ranges like this can lead to price swings. The 10-year is being squeezed in a very narrow range between support at its 100-day Moving Average and resistance at its 200-day Moving Average.