


Week of January 15, 2024 in Review
Home sales and construction slumped in December, but buyers and builders have reasons to be optimistic about the housing market this year. Find out why and more in these stories:
- December’s Existing Home Sales Likely a “Bottom”
- Home Builders Optimistic About 2024
- “Solid Showing” for Single-family Construction
- Holiday Shopping Season Stronger Than Expected
- Initial Jobless Claims Fall Below 200,000
December’s Existing Home Sales Likely a “Bottom”
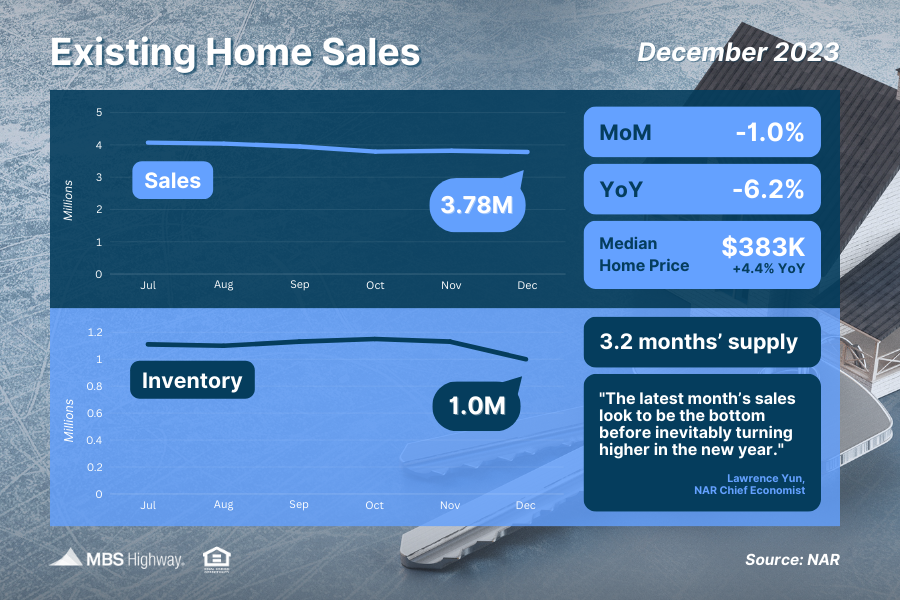
Existing Home Sales fell 1% from November to December to a 3.78-million-unit annualized pace, coming in below estimates of an unchanged reading per the National Association of REALTORS® (NAR). Sales were also 6.2% lower than they were in December 2022.
What’s the bottom line? This report measured closings on existing homes in December and likely reflects people shopping for homes in October and November, when rates peaked.
On that note, NAR’s Chief Economist, Lawrence Yun, said, “The latest month’s sales look to be the bottom before inevitably turning higher in the new year. Mortgage rates are meaningfully lower compared to just two months ago, and more inventory is expected to appear on the market in upcoming months.”
More supply is certainly needed, as there were just 1 million homes available for sale at the end of December. This was down from 1.13 million at the end of November, and below healthy levels at just a 3.2 months’ supply of homes at the current sales pace.
Home Builders Optimistic About 2024
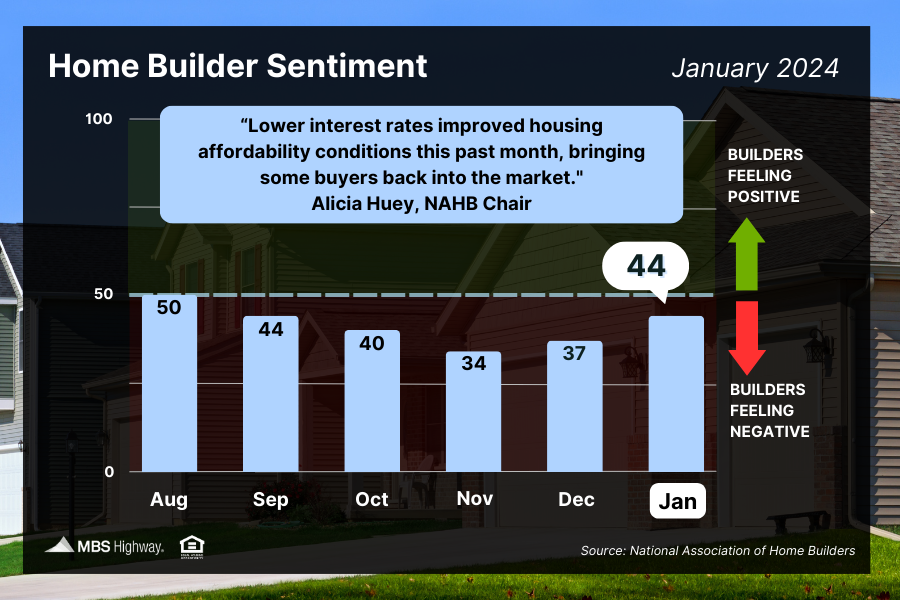
Confidence among home builders rose for the second straight month in January as falling mortgage rates have encouraged some buyers to resume their home search. The National Association of Home Builders (NAHB) Housing Market Index climbed seven points to 44, and while this is still in contraction territory below the key breakeven level of 50, the reversal marks a positive sign heading into the spring buying season.
All three index components moved higher this month. Current sales conditions rose seven points to 48, while future sales expectations surged twelve points to 57, moving into positive territory for the first time since August. Buyer traffic was also up five points to 29.
What’s the bottom line? NAHB Chair Alicia Huey noted that, “Lower interest rates improved housing affordability conditions this past month, bringing some buyers back into the market.” Plus, 31% of builders surveyed reported that they’re still reducing prices to encourage sales, providing even more opportunities for buyers right now.
“Solid Showing” for Single-family Construction
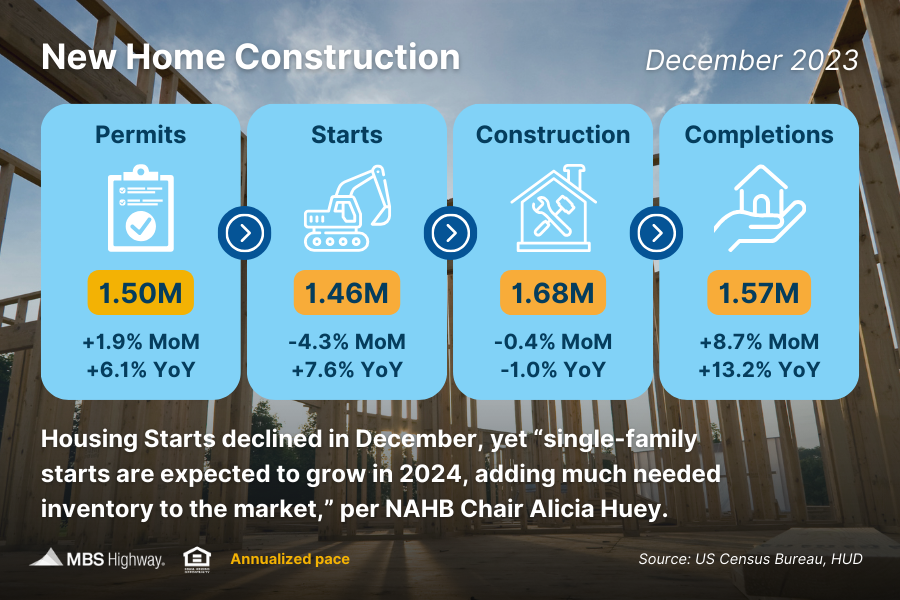
Housing Starts fell for the first time in four months in December, down 4.3% from November. While single-family Starts also saw a downtick from November, they still had a “solid showing” per the NAHB as they surpassed the million mark (1.027 million) for the second straight month. This reflects the number of single-family homes that would be built throughout the year if construction took place at the same rate in every month as it did in December.
Building Permits, which are an indication of future construction, were up 1.9% from November to December, with permits for single-family homes reaching their highest level in a year.
What’s the bottom line? “Mortgage rates steadily fell below 7% in December, and lower rates combined with a lack of existing inventory in most markets helped to keep single-family production above a one million-unit annual pace,” explained NAHB Chair Alicia Huey. “And the fact that our latest surveys showed a big increase in builder confidence is an indicator that we can expect housing starts to improve in the coming months.”
A boost in supply will be welcome news for buyers around the country who have struggled with low inventory, though there is still a long way to go to meet the level of demand that exists among buyers. When we consider the pace of completed homes that will be coming to market (around 1.57 million homes annualized) and subtract roughly 100,000 homes that need to be replaced every year due to aging, we’re well below demand as measured by household formations that are trending at 1.9 million.
More demand than supply will continue to be supportive of home values, especially when we reach the busier spring homebuying season.
What’s the bottom line? Spending at department stores, car dealerships, clothing stores and online boosted sales last month, giving some retailers a strong holiday season. While this data suggests a resilient economy, retailers likely lured shoppers with holiday discounts last month, so we’ll have to see if the strong level of spending continues this quarter. The Fed will be watching this data closely, as the strength of our economy will impact their monetary policy decisions.
Initial Jobless Claims Fall Below 200,000
Initial Jobless Claims declined by 16,000 in the latest week, with 187,000 people filing for unemployment benefits for the first time. Not only was this well below expectations, it was also the lowest reading since September 2022. Continuing Claims also fell by 26,000, with 1.806 million people still receiving benefits after filing their initial claim.
What’s the bottom line? Initial Jobless Claims data can be volatile at the start of a new year, as layoffs tend to decline around the holiday season. Yet the low number of first-time filers still suggests a tight labor market where employers are holding on to workers. And while Continuing Claims have fallen over the last few weeks, they are still elevated, especially when compared to September’s low of 1.658 million filers. This suggests it’s become harder for people to find employment once they are let go.
What to Look for This Week
More housing news is ahead when December’s New and Pending Home Sales are reported on Thursday and Friday, respectively. Thursday also brings the latest Jobless Claims while the Fed’s favored inflation measure, Personal Consumption Expenditures, will be released on Friday.
Technical Picture
Mortgage Bonds ended last week trading just above 101, which is a base that has formed over the last two weeks. If this level continues to hold, Bonds could move higher to retest the dual ceiling of resistance comprised of the 25-day Moving Average and the 101.392 Fibonacci Level. The 10-year is trading in a wide range between a ceiling at the 50-day Moving Average and support at the 200-day Moving Average.