


Mortgage Market Update March 6, 2024
The Fed’s favored inflation measure showed that annual inflation continues to progress lower, albeit slowly. And while the weather and mortgage rates impacted signed contracts for homes in January, key home price indexes revealed that 2023 was another strong year for appreciation. Here are the headlines:
-Fed’s Favored Inflation Measure in Line with Forecasts
-New Home Sales Jump in January
-Pending Home Sales Pull Back
-Home Values Continue to Move Higher
-Unemployment Claims Rise During Latest Week
Fed’s Favored Inflation Measure in Line with Forecasts
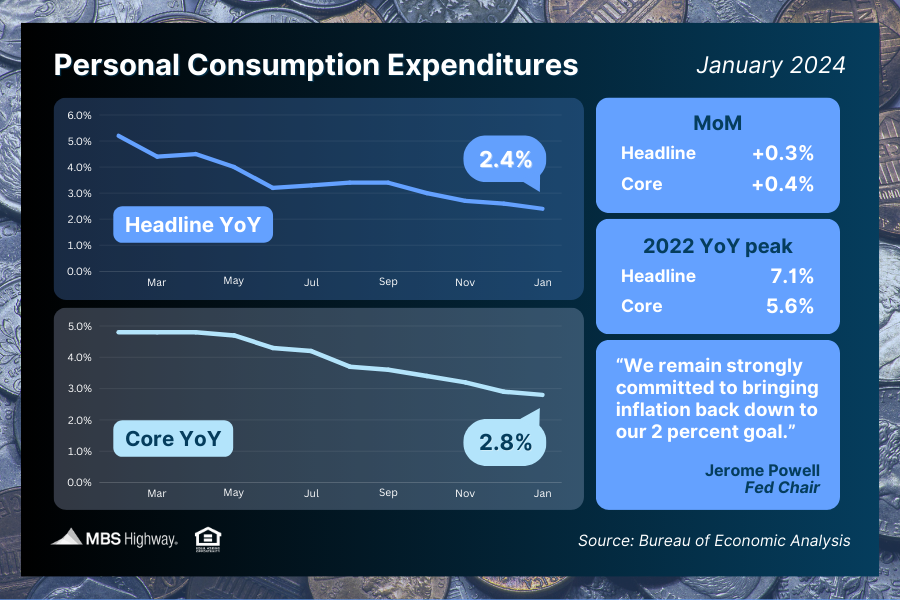
January’s Personal Consumption Expenditures (PCE) showed that headline inflation rose 0.3% for the month, with the year-over-year reading falling from 2.6% to 2.4%. Core PCE, the Fed’s preferred method which strips out volatile food and energy prices, rose by 0.4% monthly. The year-over-year reading fell from 2.9% to 2.8%, pushing this important metric one step closer to the Fed’s 2% target and its lowest level in almost three years!
These PCE readings were in line with expectations, which was welcome news after previous inflation reports for January (Consumer and Producer Price Indexes) were hotter than expected. Though the hot 0.4% monthly reading for Core PCE is something to keep an eye on. Was this a one-off or the start of a trend?
What’s the bottom line?The Fed has been working hard to tame inflation, hiking its benchmark Fed Funds Rate (which is the overnight borrowing rate for banks) eleven times between March 2022 and July 2023. These hikes were designed to slow the economy by making borrowing more expensive, lowering the demand for goods, and thereby reducing pricing pressure and inflation.
Inflation has moved lower after peaking in 2022, with the headline reading at 2.4% (down from 7.1%) and the core reading at 2.8% (down from 5.6%). Fed Chair Jerome Powell has stressed that while the Fed is “committed to returning inflation to 2% over time,” Fed members won’t “wait to get to 2% to cut rates.”
The question remains: When will the Fed think inflation has moved low enough for them to start cutting the Fed Funds Rate later this year?
New Home Sales Jump in January
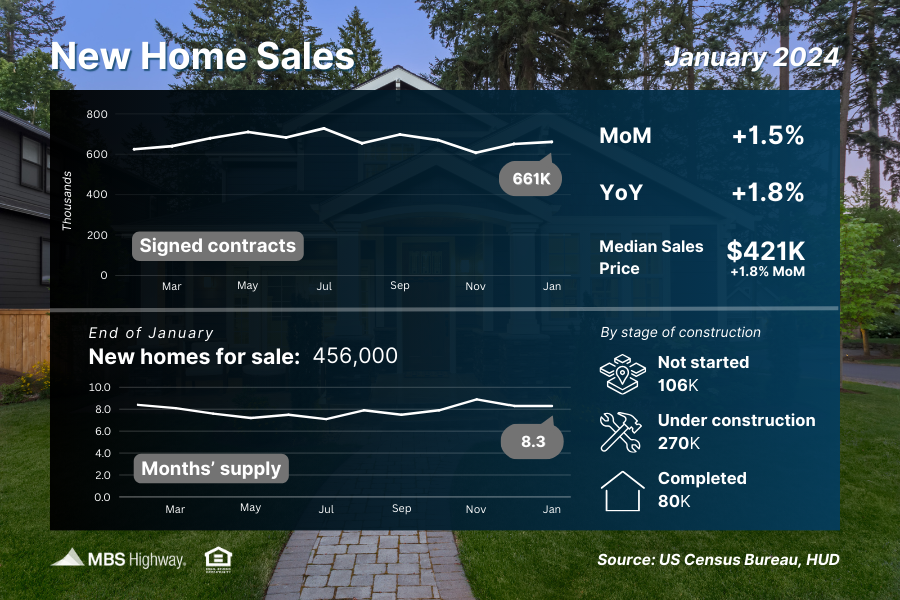
New Home Sales, which measure signed contracts on new homes, were up 1.5% from December to January, marking the second consecutive month sales increased. Signed contracts were also 1.8% higher than they were in January 2023.
What’s the bottom line? January’s modest increase wasn’t as large as economists had forecasted, as frigid temperatures around much of the country likely kept some potential buyers home last month.
However, demand for new construction remains strong due to the persistent shortage of existing homes for sale. On that note, more “available” supply is needed to meet buyer demand, especially as we head into the busy spring homebuying season. While there were 456,000 new homes available for sale at the end of January, slightly higher than the 452,000 seen in the previous report, only 80,000 were completed, with the rest either under construction or not even started yet.
Pending Home Sales Pull Back
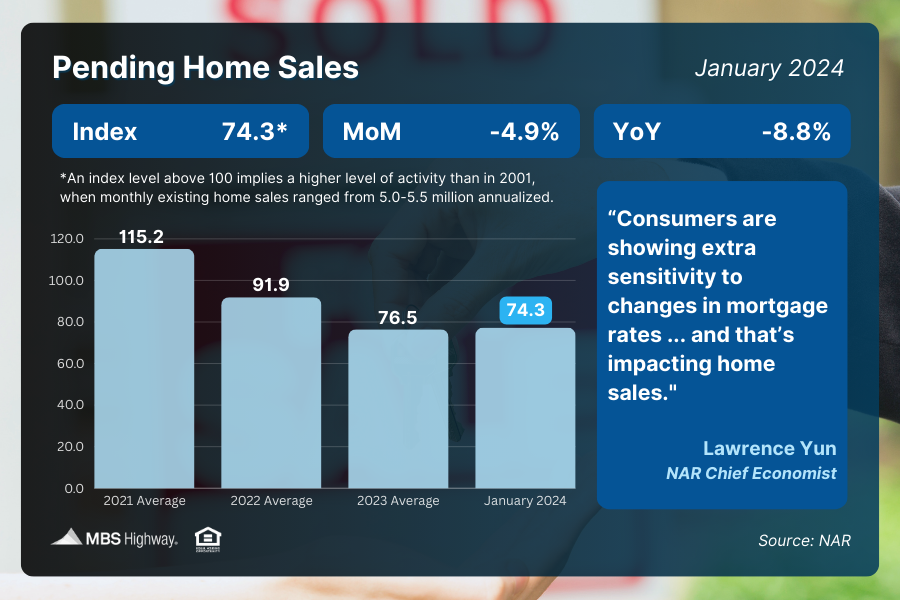
Pending Home Sales fell 4.9% from December to January per the National Association of REALTORS� (NAR), coming in below expectations. Sales were also 8.8% below the level reported in January 2023.
Pending Home Sales measure signed contracts on existing homes, making them an important forward-looking indicator for closings as measured by Existing Home Sales.
What’s the bottom line? “The job market is solid, and the country’s total wealth reached a record high due to stock market and home price gains,” said NAR Chief Economist Lawrence Yun. “This combination of economic conditions is favorable for home buying. However, consumers are showing extra sensitivity to changes in mortgage rates in the current cycle, and that’s impacting home sales.”
Home Values Continue to Move Higher
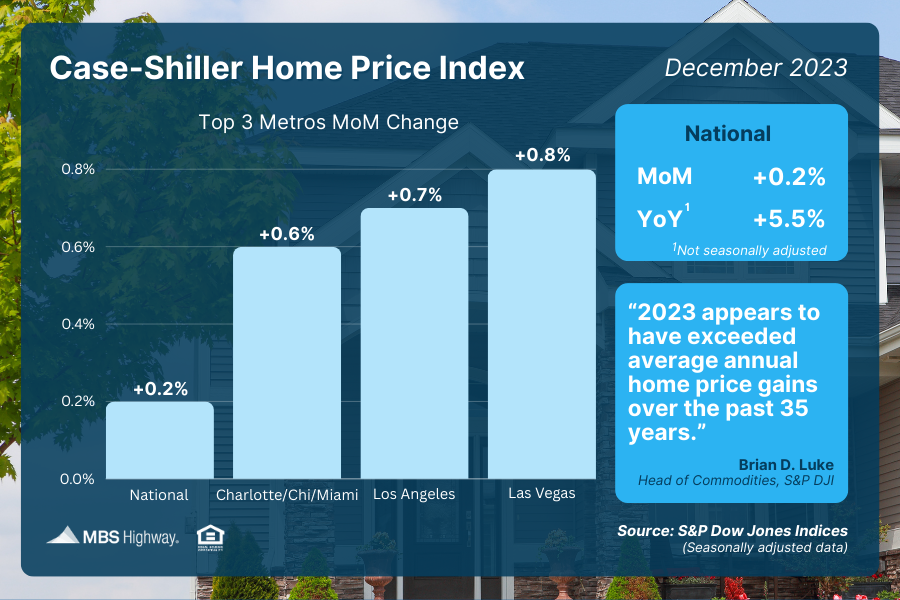
The Case-Shiller Home Price Index, which is considered the “gold standard” for appreciation, showed home prices nationwide rose 0.2% from November to December after seasonal adjustment. Home values in December were also 5.5% higher than a year earlier, with S&P DJI’s Head of Commodities, Brian D. Luke, noting that the index “continued its streak of seven consecutive record highs in 2023” and “ten of 20 markets beat prior records.”
The Federal Housing Finance Agency’s (FHFA) House Price Index also saw home prices rise 0.1% from November to December and 6.6% year-over-year, with their index setting new record highs in home prices every month since February.
Note that FHFA’s report measures home price appreciation on single-family homes with conforming loan amounts, which means it most likely represents lower-priced homes. FHFA also does not include cash buyers or jumbo loans, and these factors account for some of the differences in the two reports.
What’s the bottom line? Last year was a strong one for appreciation, with the final numbers for 2023 showing that home prices were up 5.5% per Case-Shiller and 6.6% per FHFA. Previous reporting from Black Knight (5.6%) and CoreLogic (5.5%) also reflected similar home price growth for last year. These indexes show that homeownership continues to provide opportunities for building wealth through real estate.
Unemployment Claims Rise During Latest Week
Applications for new unemployment benefits rose by 13,000 in the latest week, as 215,000 Initial Jobless Claims were filed. Continuing Claims also rose 45,000, with 1.905 million people still receiving benefits after filing their initial claim.
What’s the bottom line? While Initial Jobless Claims are still relatively low, Continuing Claims have been trending higher, with this latest reading the second highest since November 2021. The data shows that employers are still trying to hold on to workers, but once people are let go it’s more challenging for them to find new employment.
Family Hack of the Week
Delight family and friends with this light and buttery Pound Cake courtesy of Allrecipes, perfect for snacks, dessert and marking National Pound Cake Day on March 4.
Preheat oven to 325 degrees Fahrenheit. Grease and flour a bundt pan.
In a large mixing bowl, cream 3 1/4 cups sugar and 3 sticks (1 1/2 cups) unsalted butter (room temperature) on medium speed until light and fluffy, around 5 minutes. Add 6 extra large eggs, 1 at a time, beating for 45 seconds after each addition. Add 2 teaspoons vanilla extract and beat for 30 seconds.
In a medium bowl, combine 3 cups all-purpose flour, 1/2 teaspoon baking powder, 1/2 teaspoon salt and 1/4 teaspoon nutmeg. Add half the flour mixture to the butter mixture and mix on low speed until just blended. Add 1/2 cup milk and beat on low until just blended. Repeat with remaining flour mixture and another 1/2 cup of milk. Scrape the sides of the bowl with a spatula between each addition.
Pour batter into prepared dish, smoothing top with a spatula. Bake until a toothpick inserted in the center comes out clean and the cake is just starting to pull away from the sides of the pan, around 1 hour and 25 minutes. Cool for 15 minutes before inverting the cake onto a plate. Cool completely before serving.
What to Look for This Week
We’ll get more appreciation data when CoreLogic releases their Home Price Index for January on Tuesday.
Then, labor sector data will dominate the headlines, starting Wednesday with the JOLTS (job openings) report for January and February’s ADP Employment Report, which measures private payrolls. The latest Jobless Claims will be released on Thursday, while Friday brings February’s Jobs Report from the Bureau of Labor Statistics, which includes Non-farm Payrolls and the Unemployment Rate.
Technical Picture
Mortgage Bonds broke above the formidable 100.428 Fibonacci ceiling that has kept a lid on prices since mid-February. Bonds have more room to the upside until reaching the next ceiling of resistance at the 25-day Moving Average. The 10-year ended last week challenging a dual floor comprised of the 200-day and 25-day Moving Averages at around 4.18%.